
Leslie Matrices, part 1
Of Life, Death and Linear Algebra
I first stumbled upon the fascinating world of Leslie matrices in an elective math course back in high school. It was one of those moments that made abstract concepts like matrices and vectors feel incredibly real and powerful—a tool to actually model the messy, complex cycle of life. It really kickstarted my interest in applied math, and in this post, I want to share a little bit of that magic.
We’ll explore a family of population growth models based on linear algebra.
The basic idea is to structure a population’s demographics by age. This is encoded in a vector $N(t)$. To make our model more detailed, we’ll divide the female population into four age groups:
- Group 1: Ages 0-14 (Children)
- Group 2: Ages 15-29 (Young Adults)
- Group 3: Ages 30-49 (Mature Adults)
- Group 4: Ages 50+ (Seniors)
The number of females in each group at a time $t$ is represented by a population vector $N(t)$:
\[N(t) = \begin{pmatrix} n_1(t) \\ n_2(t) \\ n_3(t) \\ n_4(t) \end{pmatrix}\]Our goal is to predict the population at the next time step, $N(t+1)$, by modeling survival and reproduction.
Building the Leslie Matrix
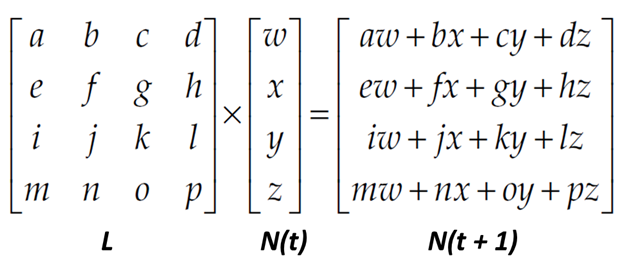
We can project the population into the future using a special matrix, which we’ll call $L$. The core relationship is simple:
\[N(t+1) = L \cdot N(t)\]The matrix $L$ is built from two key types of data:
1. Fecundity Rates ($f_i$) 🐣👶
Fecundity is the average number of female offspring born to a female in an age group during one time step. These rates form the first row of our matrix.
- $f_1$: Avg. offspring for group 1 (0-14). Usually zero or very low.
- $f_2$: Avg. offspring for group 2 (15-29). This will likely be the highest.
- $f_3$: Avg. offspring for group 3 (30-49). Still significant but lower than group 2.
- $f_4$: Avg. offspring for group 4 (50+). This is zero.
2. Survival Rates ($s_i$) ❤️🩹💀
Survival rate is the probability of an individual surviving from one time step to the next.
-
$s_1, s_2, s_3$: These are the probabilities that an individual from group 1, 2, or 3 will survive to enter the next group (2, 3, or 4). These are placed on the sub-diagonal of the matrix.
-
$s_4$: This is a modification to the classic Leslie model. We’ll add a survival rate for the final age group. This represents the probability that someone in group 4 (50+) will survive and remain in group 4 in the next time step. This value goes in the bottom-right corner of the matrix, on the main diagonal.
With four age groups, our matrix $L$ looks like this:
\[L = \begin{pmatrix} f_1 & f_2 & f_3 & f_4 \\ s_1 & 0 & 0 & 0 \\ 0 & s_2 & 0 & 0 \\ 0 & 0 & s_3 & s_4 \end{pmatrix}\]A Concrete Example
Let’s use some hypothetical numbers for a 15-year time step:
- $f_1 = 0.05$ (low)
- $f_2 = 1.3$ (peak reproductive years)
- $f_3 = 0.8$ (lower, but still reproductive)
- $f_4 = 0.0$ (post-reproductive)
- $s_1 = 0.98$ (98% survive from group 1 to 2)
- $s_2 = 0.95$ (95% survive from group 2 to 3)
- $s_3 = 0.90$ (90% survive from group 3 to 4)
- $s_4 = 0.60$ (60% of seniors survive the 15-year period and remain in the 50+ group)
Our Leslie matrix is:
\[L = \begin{pmatrix} 0.05 & 1.3 & 0.8 & 0 \\ 0.98 & 0 & 0 & 0 \\ 0 & 0.95 & 0 & 0 \\ 0 & 0 & 0.90 & 0.60 \end{pmatrix}\]Now, imagine our initial population at time $t=0$ is:
\[N(0) = \begin{pmatrix} 1000 \\ 900 \\ 850 \\ 700 \end{pmatrix}\]We calculate the population 15 years later, $N(1) = L \cdot N(0)$:
\[N(1) = \begin{pmatrix} 0.05 & 1.3 & 0.8 & 0 \\ 0.98 & 0 & 0 & 0 \\ 0 & 0.95 & 0 & 0 \\ 0 & 0 & 0.90 & 0.60 \end{pmatrix} \begin{pmatrix} 1000 \\ 900 \\ 850 \\ 700 \end{pmatrix} = \begin{pmatrix} (0.05 \cdot 1000) + (1.3 \cdot 900) + (0.8 \cdot 850) + (0 \cdot 700) \\ (0.98 \cdot 1000) \\ (0.95 \cdot 900) \\ (0.90 \cdot 850) + (0.60 \cdot 700) \end{pmatrix} = \begin{pmatrix} 50 + 1170 + 680 \\ 980 \\ 855 \\ 765 + 420 \end{pmatrix} = \begin{pmatrix} 1900 \\ 980 \\ 855 \\ 1185 \end{pmatrix}\]So, after 15 years, our model predicts 1900 children, 980 young adults, 855 mature adults, and 1185 seniors.
What’s Next?
This model is powerful because it does more than just step-by-step prediction. By analyzing the eigenvalues and eigenvectors of the Leslie matrix, we can uncover the long-term behavior of the population, such as its stable growth rate and its eventual age distribution. But that’s a topic for Part 2!